


Choosing the Best Data Manipulation Package in Python: A Comprehensive Comparison


Introduction
Pandas is one of the most widely used data manipulation libraries in Python, known for its ease of use and powerful functionality. However, as the data size grows, Pandas can become slow and memory-intensive. In this blog post, we will compare four data manipulation libraries in Python: Pandas, Koalas, Dask, and Polars, to evaluate their performance, distributed computing capabilities, and expressiveness.
Author’s Hot Takes on Data Manipulation Libraries 🔥
If you are in a hurry and don’t want to read the whole blog post, here are my hot takes on these libraries:
Pandas: Life feels so easy here! It’s the most widely used data manipulation library in Python and for good reason. It’s easy to learn, easy to use and has a wide range of functionality. However, it can be slow and memory-intensive for large datasets.

Koalas: don’t adopt this unless you are a Spark power user since you need to be familiar with Spark’s concepts to use it effectively. Another BIG downside of koalas is being a true dependency hell at least in 2023! It doesn’t work with Python 3.10 and above! It also trow random errors because of using deprecated versions of Numpy and Pandas. Truly a nightmare!

Dask: Despite being the only one not to use a cute animal name! Dask seems a very good fit if you have access to a multi-node cluster like HPC clusters since it can leverage all of those computing power. It gets a lot of performance boost from using lazy loading and parallel processing. However, the concept of lazy loading can be confusing for some users and it’s not as easy to use as Pandas.

Polars: Written in the loved Rust language, Polars provides a more efficient memory representation and multi-threading, making it faster than Pandas for large datasets. Very good choice if you have a single machine with multiple cores. It’s also very easy to use and has a very similar API to Pandas.

Comparison: Performance on Different Data Sizes
Pandas: Performs well on small to medium-sized datasets, but struggles with large datasets due to memory limitations.
Koalas: Built on top of Apache Spark, Koalas provides a Pandas-like API for distributed computing, making it better suited for larger datasets.
Dask: Allows parallel and distributed processing of large datasets, which can be significantly faster than Pandas on larger datasets.
Polars: Uses a more efficient memory representation and multi-threading, making it faster than Pandas for large datasets.
Comparison: Distributed Computing Capabilities
Pandas: Single-node, in-memory computing.
Koalas: Multi-node, distributed computing on top of Apache Spark.
Dask: Multi-node, distributed computing with a similar API to Pandas.
Polars: Single-node, multi-threaded computing.
Comparison: Integration with Visualization Tools and Other Python Libraries
Pandas: Widely used and well-integrated with visualization libraries like Matplotlib and Seaborn, as well as Python ML libraries.
Koalas: Can be converted to a Pandas DataFrame for integration with other libraries, but may lose distributed computing benefits.
Dask: Can be converted to a Pandas DataFrame for integration with other libraries, but may lose distributed computing benefits.
Polars: Less widely used and may not be as well-integrated with other libraries.
Comparison: Query Language Expressiveness
To compare the expressiveness of the query languages, let’s look at how each library handles a common task: filtering the data for transactions where the quantity sold is greater than 10, and grouping by product ID to calculate the average price.
Pandas
import pandas as pd
data = pd.read_csv("sales_data.csv")
filtered_data = data[data["Quantity Sold"] > 10]
grouped_data = filtered_data.groupby("Product ID")["Price"].mean()
Koalas
from databricks import koalas as ks

data = ks.read_csv("sales_data.csv")
filtered_data = data[data["Quantity Sold"] > 10]
grouped_data = filtered_data.groupby("Product ID")["Price"].mean()
Dask
import dask.dataframe as dd

data = dd.read_csv("sales_data.csv")
filtered_data = data[data["Quantity Sold"] > 10]
grouped_data = filtered_data.groupby("Product ID")["Price"].mean().compute()
Polars
import polars as pl

data = pl.read_csv("sales_data.csv")
filtered_data = data.filter(data["Quantity Sold"] > 10)
grouped_data = filtered_data.groupby("Product ID").agg(pl.col("Price").mean())
As you can see, the query language for all of these libraries is very similar to Pandas, with only minor differences in syntax. This makes it easy to switch between libraries or use multiple libraries in the same project.
Benchmark: Data Preparation
For this comparison, we will use a dataset of retail sales transactions. The dataset contains millions of rows, with columns such as “Transaction ID,” “Product ID,” “Quantity Sold,” “Price,” “Date,” and “Store ID”. We have preprocessed the data by removing any missing or duplicate values, and converting categorical variables to numerical encodings. The following code snippet create a sample random dataset with N rows:
import numpy as np import pandas as pd from datetime import datetime, timedelta

def generate_data(n):
    transaction_id = np.arange(1, n+1)
    product_id = np.random.randint(1, 1001, n)
    quantity_sold = np.random.randint(1, 21, n)
    price = np.random.uniform(1, 100, n)
    start_date = datetime.now() - timedelta(days=365)
    end_date = datetime.now()
    date = [start_date + (end_date - start_date) * np.random.random() for _ in range(n)]
    store_id = np.random.randint(1, 101, n)
    data = pd.DataFrame({
        "Transaction ID": transaction_id,
        "Product ID": product_id,
        "Quantity Sold": quantity_sold,
        "Price": price,
        "Date": date,
        "Store ID": store_id
    })
    return data
Benchmark: Filtering and GroupBy Performance
To compare the performance of the different libraries, we will use the previous section’s code snippets to filter the data for transactions where the quantity sold is greater than 10, and group by product ID to calculate the average price. We will run this code snippet on datasets of different sizes, ranging from 10 thousand to 10 million rows.
Here is the result for the filtering benchmark:
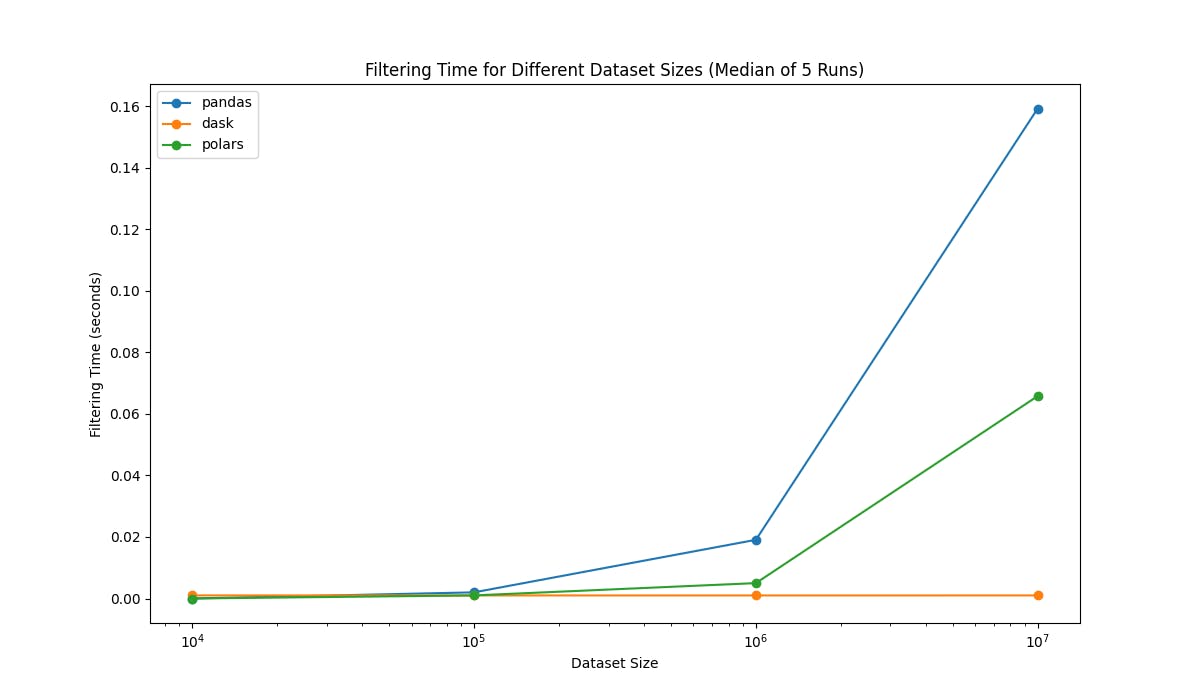
Note: Dask use lazy loading so it doesn’t actually load the data until we call compute() method. That’s why it show a constant performance regardless of dataset size.
And here is the result for groupby benchmark:
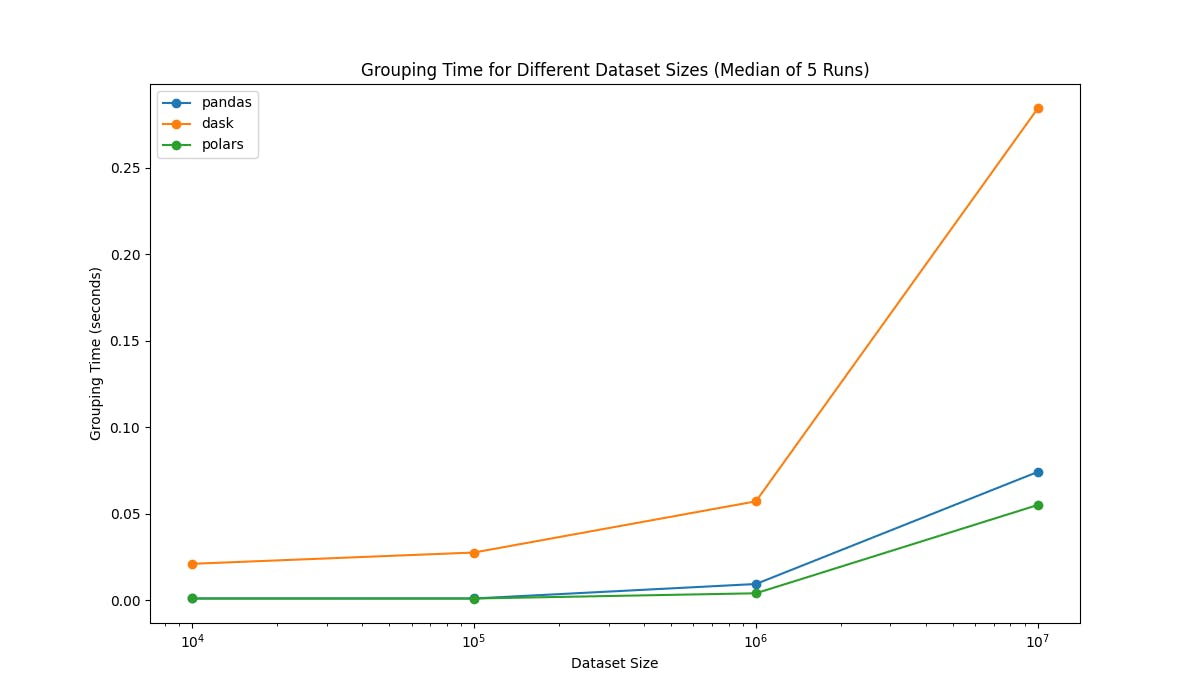
Note: Here I ran the benchmark on a machine with 7 cores (AMD Ryzen 4000) and 16GB of RAM. The results may vary on different machines.
Conclusion
The choice of data manipulation library depends on the size of the dataset, the complexity of the data manipulation tasks, and the need for integration with other Python libraries. Pandas is a versatile and powerful library for small to medium-sized datasets, while Koalas, Dask, and Polars are better suited for larger datasets.