How We Rank AI Models in Dutch
How DutchRank turns thousands of fuzzy human preferences into a trustworthy leaderboard — Elo, Bradley‑Terry, bootstrap confidence intervals, and style‑bias control, adapted for Dutch.

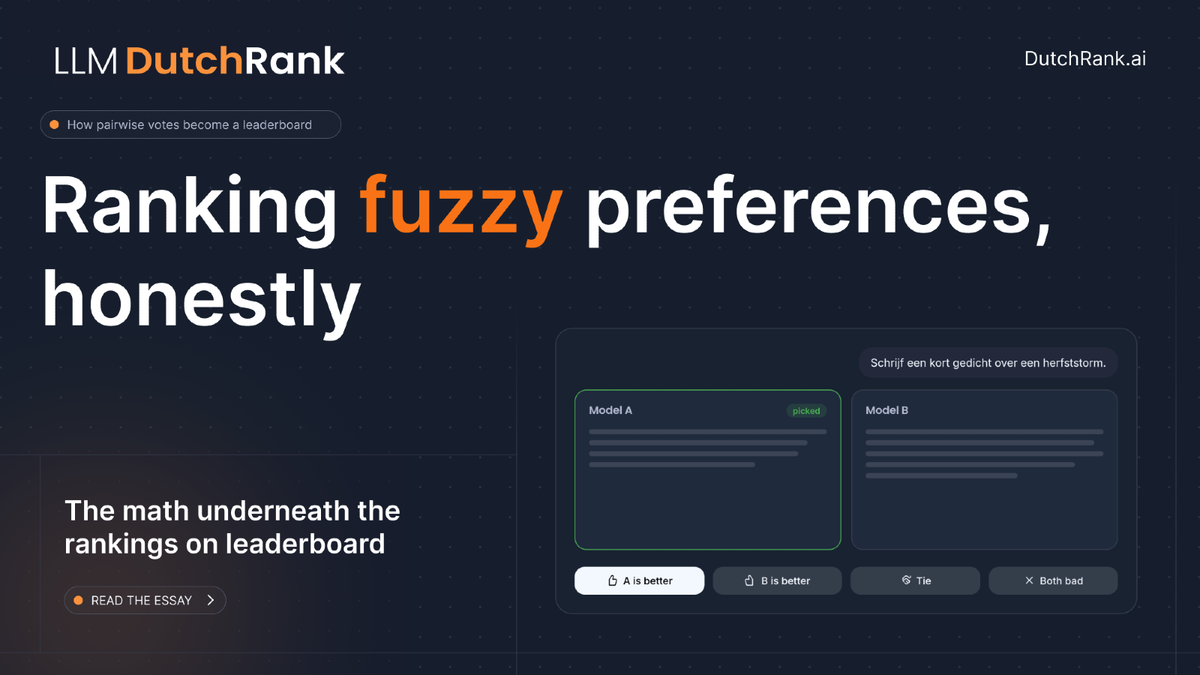
Part 1 — DutchRank: Why the Netherlands Needs Its Own AI Arena — makes the case for a Dutch-native evaluation arena.
A chess game has an objective outcome. A conversation does not.
When a Dutch speaker reads two AI responses and picks the one that "sounds better," they're making a subjective judgment shaped by grammar, tone, cultural fit, and personal preference. There's no ground truth. And yet, from thousands of these fuzzy preferences, we need to produce a single, reliable ranking.
The key insight: don't ask people to score responses. Ask them to compare. Rating a response on a 1-10 scale produces wildly inconsistent results. Ask someone which of two responses is better, and agreement rates jump dramatically. Every DutchRank battle produces exactly this — a pairwise comparison. We also automatically detect the language of each battle so only Dutch-language conversations feed the leaderboard — keeping the signal native.
The question then becomes: how do you turn pairwise votes into a leaderboard?
Two Rating Systems, One Leaderboard
Our ranking implementation builds on the open-source methodology developed by Chatbot Arena (LMSYS)[1], adapted for the specific challenges of Dutch-language evaluation — smaller sample sizes, sparser matchup matrices, and the need for language-specific filtering.
Elo: The Familiar Baseline
Our first system is the classic Elo algorithm, adapted from chess. Every model starts at 1000. After each battle, ratings shift based on the result.
The expected probability that Model A beats Model B:
$$ P(A > B) = \frac{1}{1 + 10^{(R_B - R_A) / 400}} $$
After each battle, ratings update:
$$ R_A' = R_A + K \cdot (S - P(A > B)) $$
Where S is the actual outcome (1.0 for win, 0.5 for tie, 0.0 for loss) and K controls how much each battle matters. We deliberately use a small K — far smaller than chess (where K sits between 10 and 40). Unlike a chess player, a model's underlying strength doesn't change between turn 14 and turn 15. We want ratings to converge to a stable estimate, not chase noise.
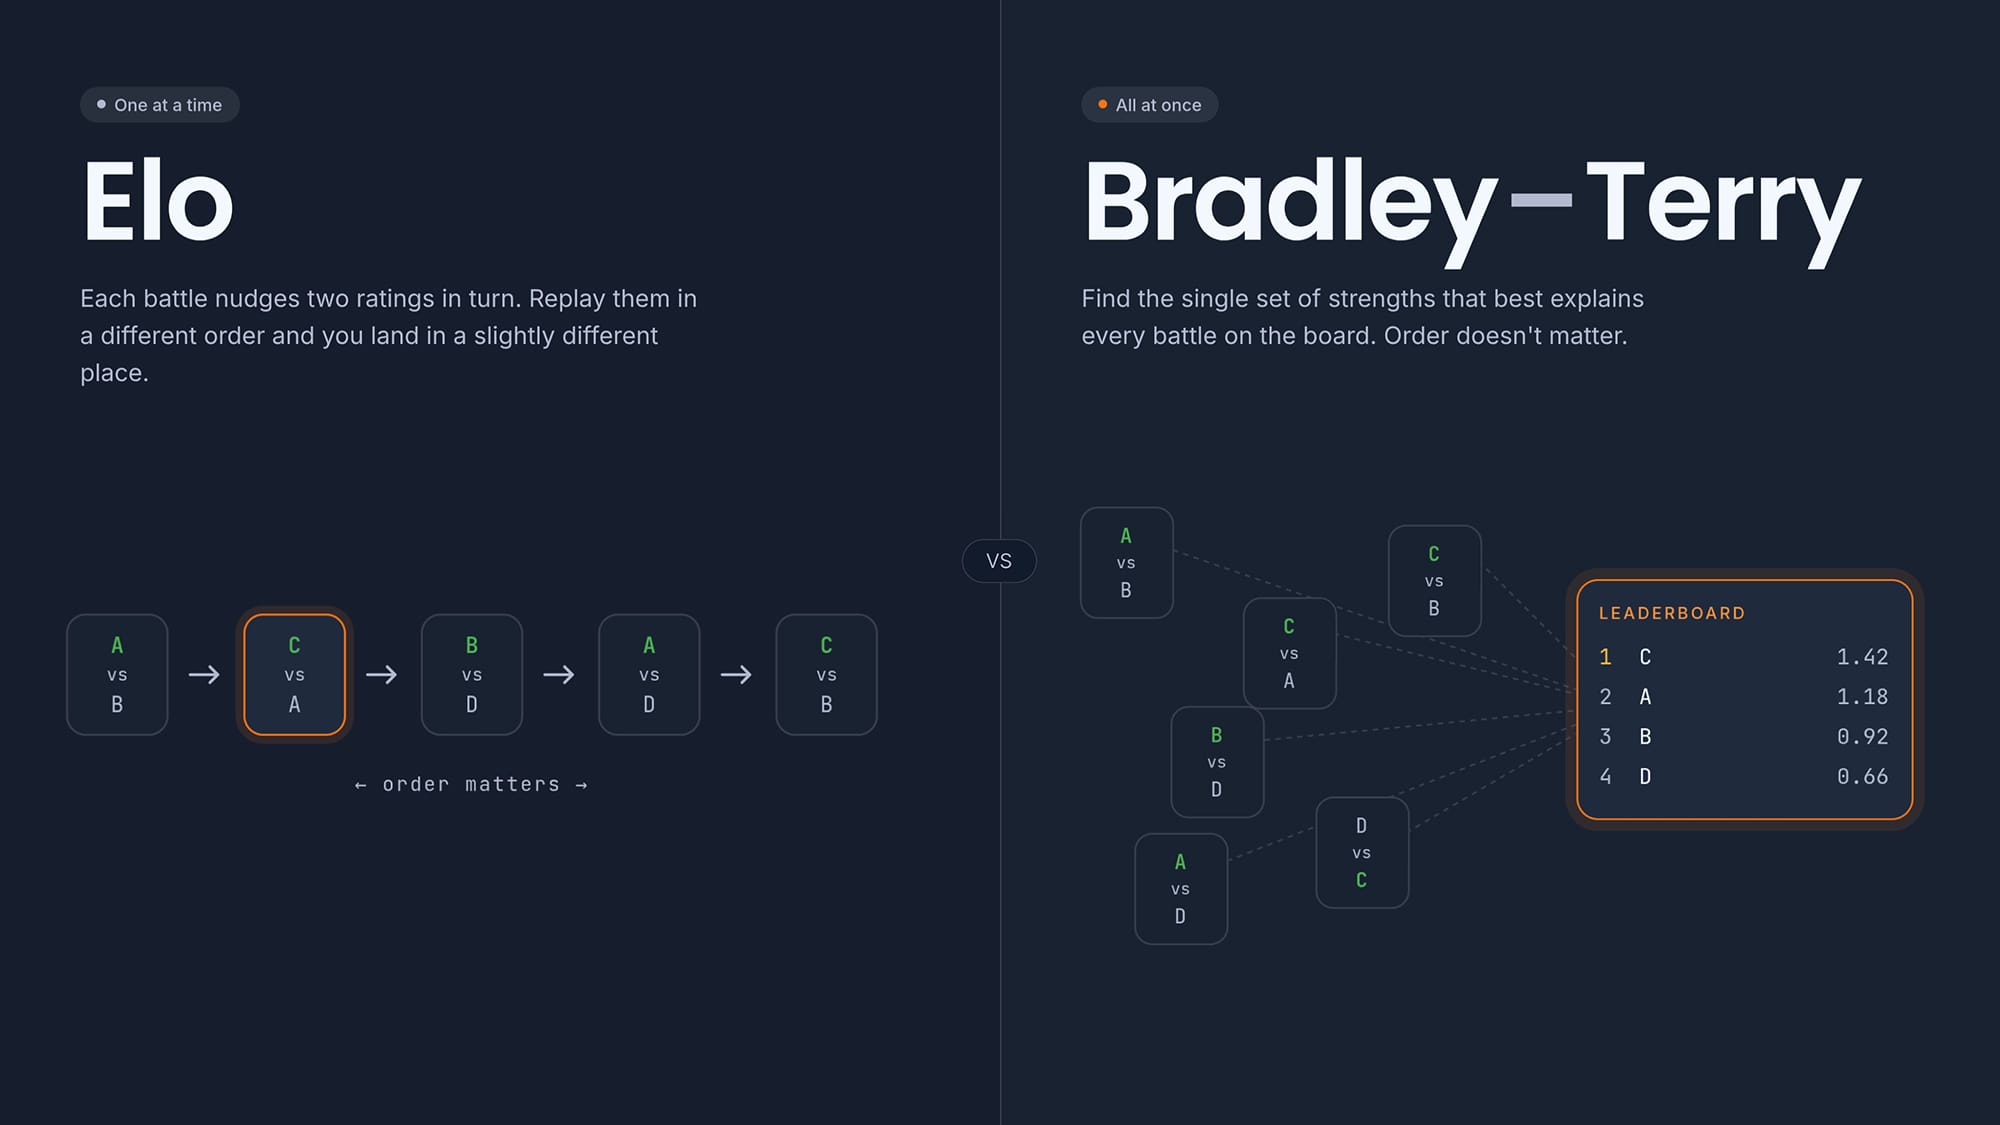
Elo is intuitive and fast. But it has a limitation: results depend on the order battles are processed. Shuffle the same data and you get slightly different ratings.
Bradley-Terry: The Source of Truth
The Bradley-Terry model[2] fixes this. Instead of processing battles one at a time, it looks at all battles simultaneously and asks: what set of model strengths best explains all the outcomes we observed?
Each model gets a strength parameter \(\theta_i\). The probability of model \(i\) beating model \(j\) is:
$$ P(i > j) = \frac{1}{1 + e^{-(\theta_i - \theta_j)}} $$
We find the optimal \(\theta\) values by minimizing the negative log-likelihood with L2 regularization:
$$ \mathcal{L} = -\sum_{(i,j)} \left[ y_{ij} \log p_{ij} + (1 - y_{ij}) \log(1 - p_{ij}) \right] + \lambda \|\theta\|^2 $$
Solved via L-BFGS-B optimization — a quasi-Newton method that converges in seconds even with thousands of matchups.
Why Bradley-Terry over Elo?
- Order-independent — same data always produces the same ratings
- Statistically principled — maximum likelihood estimation enables proper confidence intervals
- Handles sparse data — regularization prevents extreme ratings from a handful of matchups
- Extensible — naturally extends to control for confounding variables (more on this below)
We keep both systems: Elo as a sanity check, Bradley-Terry as the primary ranking method.
Confidence Intervals: How Certain Are We?
A rating without uncertainty is just a number. With the relatively small sample sizes in Dutch-language evaluation, knowing how confident we are matters as much as the ranking itself.
We compute 95% confidence intervals via bootstrap resampling: we refit the Bradley-Terry model many times on resampled data and look at the spread of the resulting ratings.
On the leaderboard, this appears as: Model X: 1445 ± 20 — meaning we're 95% confident the true rating falls between 1425 and 1465. When two models have overlapping intervals, we surface that honestly as a statistical tie. Claiming one is definitively better would be misleading.
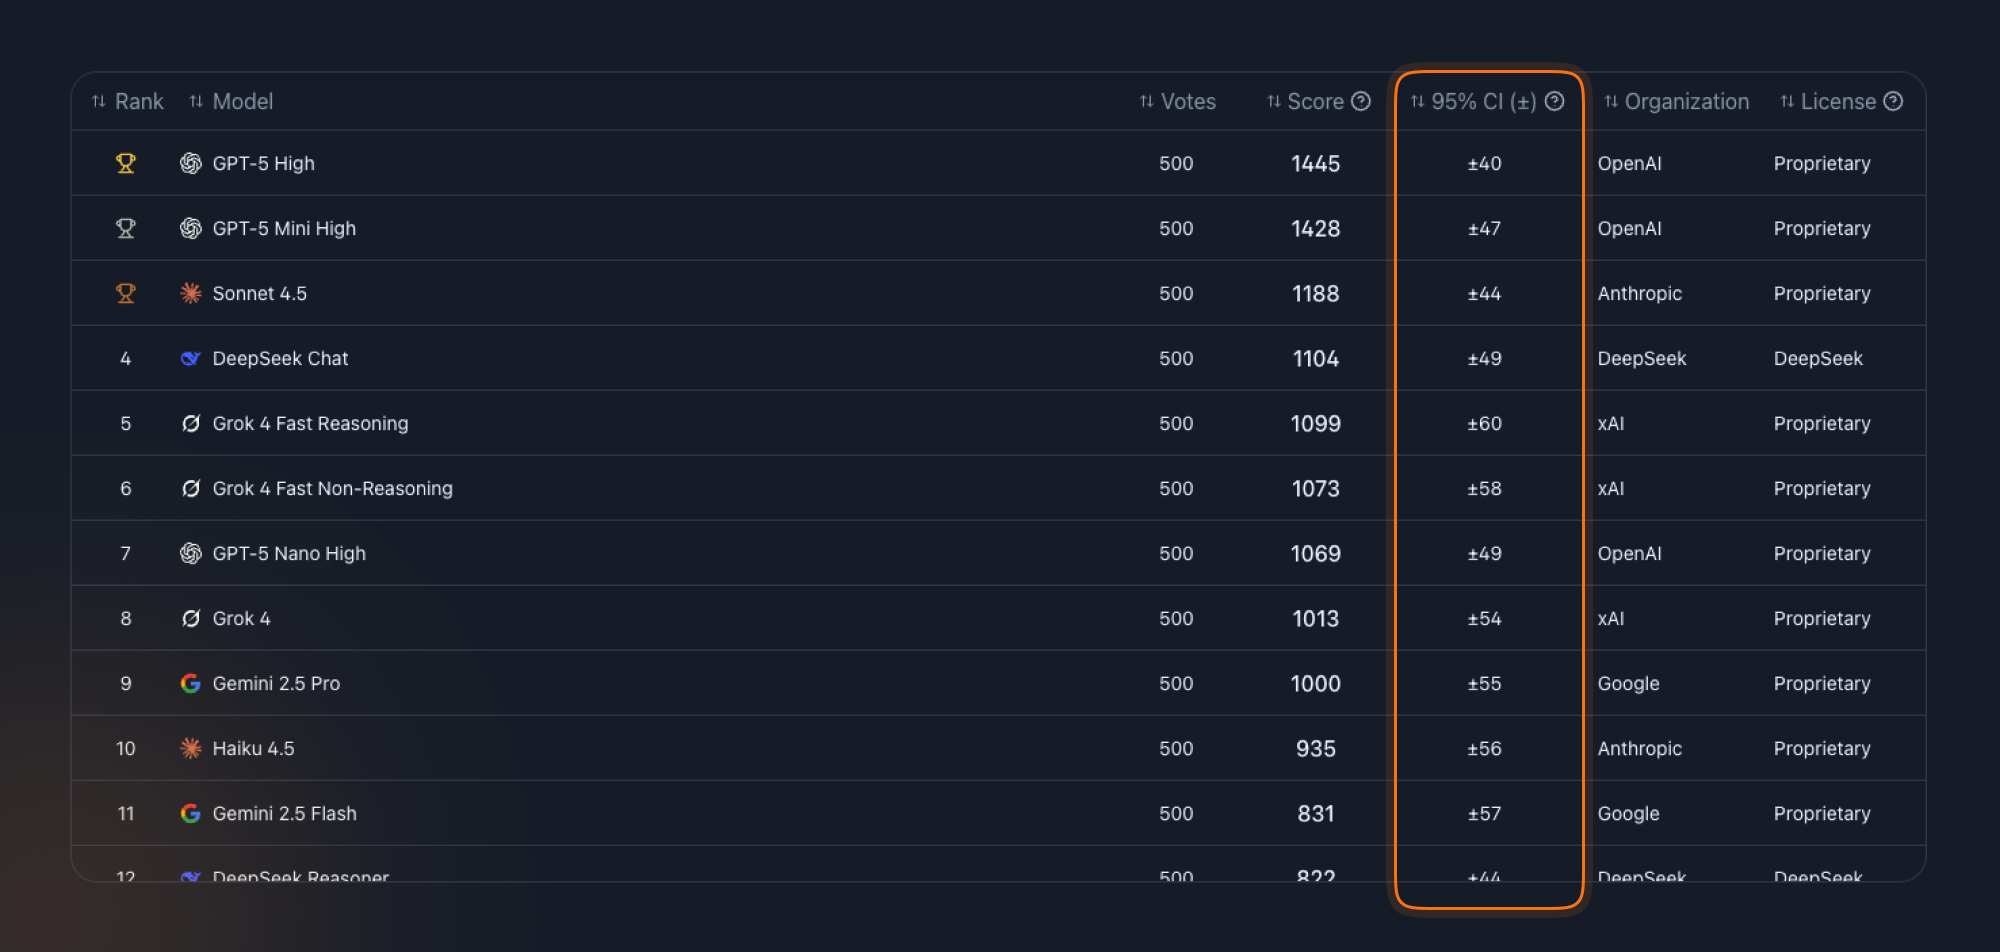
A key optimization: we resample from unique (model A, model B, outcome) triples weighted by frequency, rather than individual battles. The statistical properties are identical, but computation is dramatically faster — which matters because we recompute the leaderboard continuously as votes arrive, not on a nightly or weekly batch.
Why Regularization Matters Here
Regularization pulls uncertain ratings toward the mean, preventing a handful of lucky (or unlucky) matchups from producing extreme scores. We tune it deliberately for our dataset, which differs from larger English arenas in three important ways:
- Smaller sample sizes — Dutch-language evaluation has fewer participants than English arenas
- Sparse matchup matrices — not all model pairs have equal numbers of battles
- Cold-start models — when a new model enters the arena, it has very few comparisons
As more data accumulates, the regularization effect naturally diminishes and the data speaks for itself.
Style Bias: The Hidden Confounder
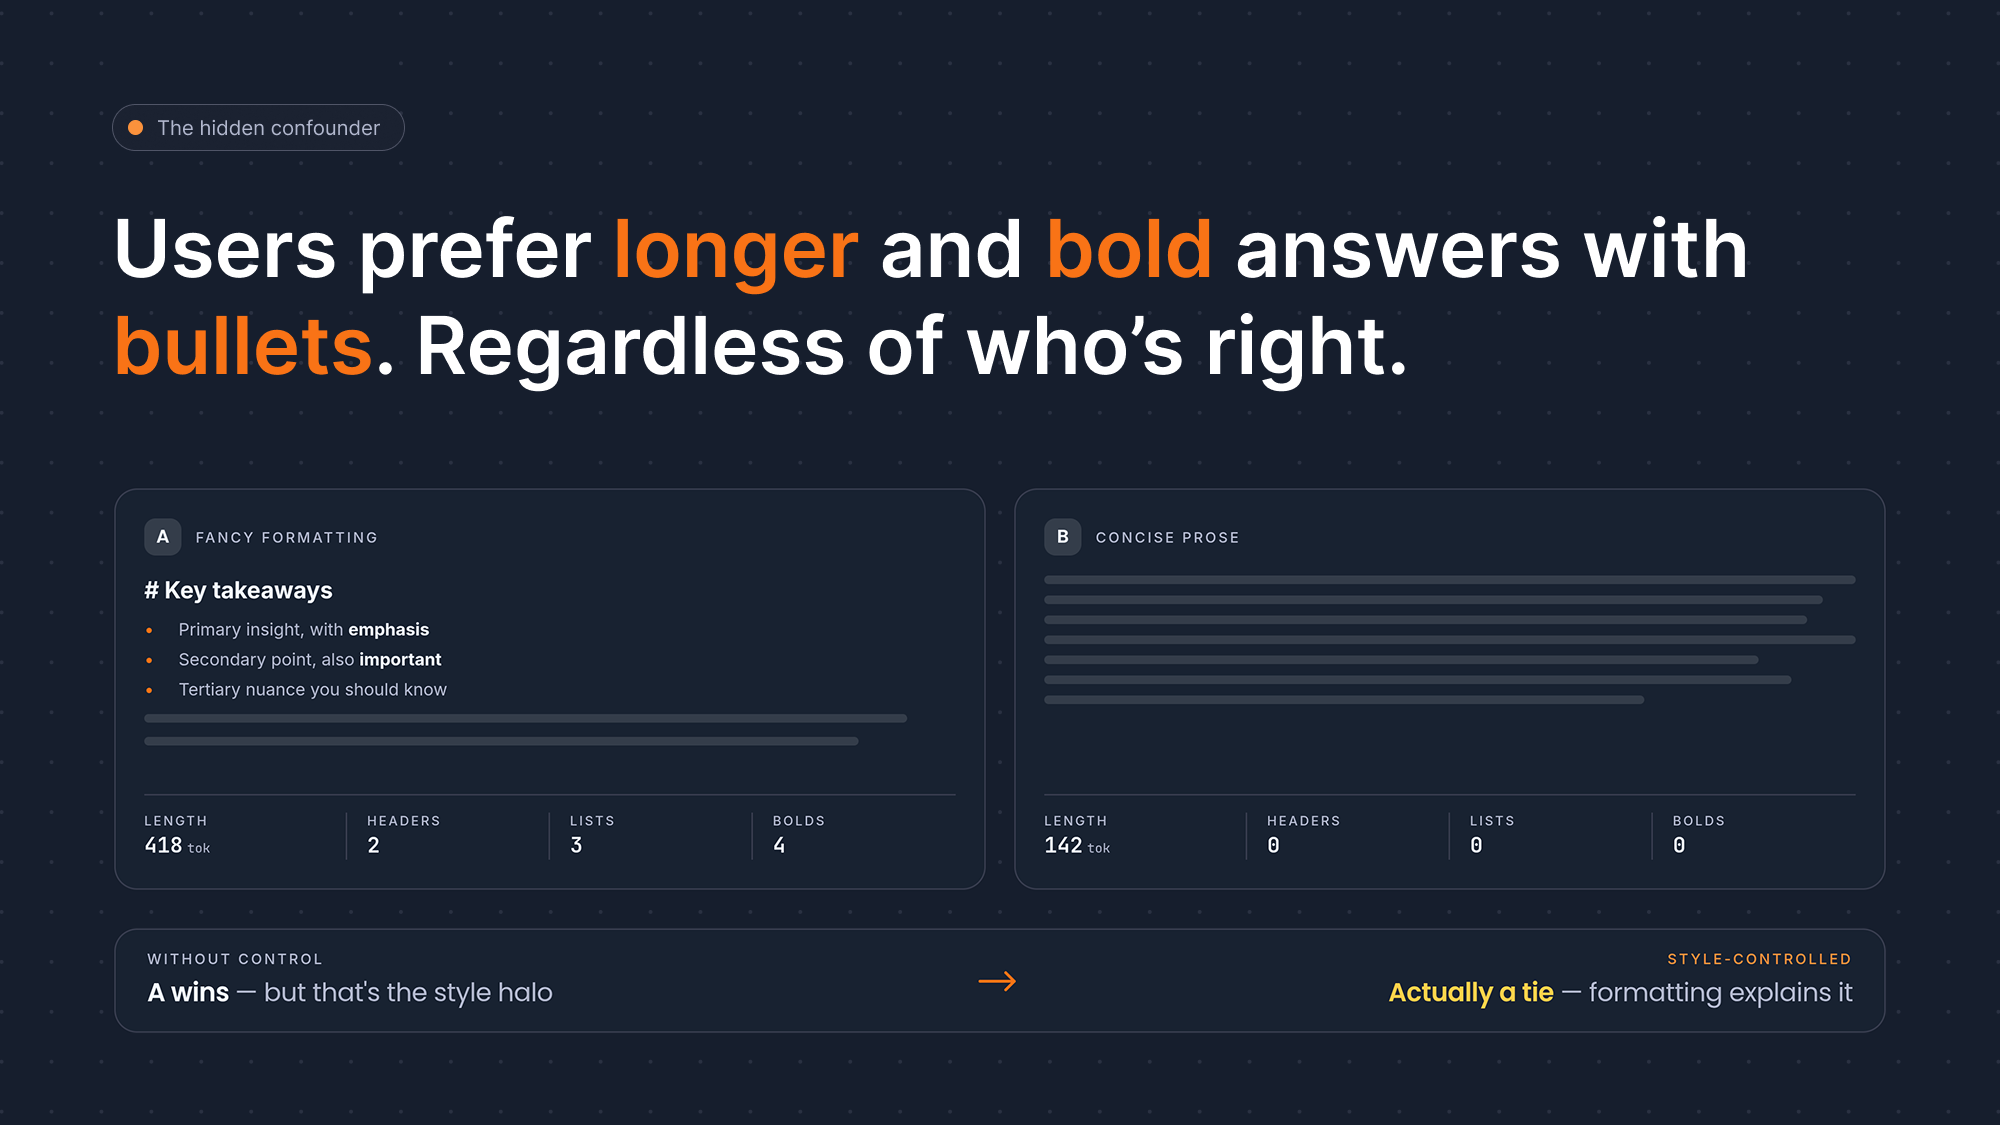
We discovered something early: users tend to prefer longer responses. Responses with bullet points. Responses with bold text and headers. Regardless of whether the actual content is better.
Without correction, the leaderboard partly measures which model formats its answers more attractively — not which one writes better Dutch.
We address this with a style-controlled Bradley-Terry model that tracks four formatting features — response length, header count, list count, and bold emphasis — and mathematically separates their effect from the quality signal:
$$ \text{logit}(p_{ab}) = \beta_0 (\theta_a - \theta_b) + \sum_i \beta_i \cdot \frac{s_{a,i} - s_{b,i}}{s_{a,i} + s_{b,i}} $$
Where \(\theta_a, \theta_b\) are the quality ratings, \(s_{a,i}\) and \(s_{b,i}\) are the style features (length, headers, lists, bold) for each response, and \(\beta_0, \beta_i\) are fit simultaneously.
The model estimates quality ratings and style coefficients simultaneously. The style coefficients absorb the variance explained by formatting differences, leaving the model ratings to reflect actual content quality. A concise, well-written response isn't penalized for skipping the bullet points.
Engineering Fair Battles
The statistics only work if the battles themselves are fair. Two engineering decisions protect the integrity of every comparison.
Stream Synchronization
Both models generate tokens in parallel, streamed via Server-Sent Events. But here's the problem: if we rendered tokens as they arrived, one model might start appearing on screen a full second before the other. Users would notice. They'd start associating "fast" with "good" — or worse, they'd guess which model is which based on response latency alone.
So we hold rendering until both models have started responding. The user sees both responses appear at roughly the same time. Under the hood, the system tracks each model's streaming state atomically in the database. A battle turn only finalizes when both models have completed — using atomic database operations to eliminate race conditions between the two parallel streams.
Vote Integrity
A vote is only accepted when both models have finished responding and at least one response is valid. Without this check, a user could vote while one model is still mid-sentence — an unfair comparison. Duplicate votes on the same battle are prevented at the database level with a unique index. And when a model's API fails entirely, the error response is excluded from the comparison — infrastructure reliability isn't what we're evaluating.
AI-as-Judge: A Second Opinion
Human votes are our gold standard, but they're slow to accumulate. To bootstrap the leaderboard, we run a parallel track where a strong AI judge model evaluates response pairs and produces a second leaderboard, following the Arena-Hard methodology[3].
We're upfront about the limitations:
- AI judges have their own biases — they tend to prefer verbose responses
- They sometimes favor their own model family
- They can't evaluate cultural nuance or catch subtle Dutch grammar errors the way a native speaker can
That's why we show both leaderboards side by side. They complement each other — and when they disagree, that's often the most interesting signal.
The Full Pipeline
Every vote triggers a computation pipeline (throttled so we don't recompute on every single vote):

The heavy bootstrap computation runs in a background thread pool to keep the async event loop responsive. A lock ensures only one update runs at a time — no race conditions, no stale data, no double computation.
What It All Adds Up To
Ranking language models is not a solved problem — especially for a language that most AI benchmarks ignore. The methods we've described here — pairwise comparison, Bradley-Terry estimation, bootstrap confidence intervals, style control — are our best attempt at turning subjective human preferences into honest, reliable rankings.
None of it works without the votes. The math gives us a framework, but the signal comes from real Dutch speakers making real judgments about real responses. Every battle that gets voted on makes the leaderboard a little more accurate, the confidence intervals a little tighter, and the rankings a little more trustworthy.
That's the invitation. Visit dutchrank.ai, try a battle, and bring the prompts you'd actually use at work — that's the data that makes the leaderboard worth trusting.
References
- Chiang, W.-L., Zheng, L., Sheng, Y., et al. (2024). Chatbot Arena: An Open Platform for Evaluating LLMs by Human Preference. arXiv:2403.04132
- Bradley, R. A., & Terry, M. E. (1952). Rank Analysis of Incomplete Block Designs: I. The Method of Paired Comparisons. Biometrika, 39(3/4), 324–345. JSTOR
- Li, T., Chiang, W.-L., Frick, E., et al. (2025). From Crowdsourced Data to High-Quality Benchmarks: Arena-Hard and BenchBuilder Pipeline. ICML 2025. arXiv:2406.11939