Glue configuration for optimal logging and cost efficiency
Custom Log4J for Spark on Glue to decrease CloudWatch cost!

Introduction
In today's cloud-centric computing environment, managing costs while ensuring optimal performance can be quite the balancing act, especially when dealing with large-scale data processing tasks. AWS Glue is frequently employed to prepare and transform data for analytics and streaming use cases. One area where costs can unexpectedly mount is logging, particularly when using services like Amazon CloudWatch. This blog post will guide you through configuring Log4J for Spark on AWS Glue to optimize logging and achieve cost efficiency.
Understanding the Basics
Before diving into the specifics, it’s essential to understand what AWS Glue, Spark, Log4J, and Amazon CloudWatch entail and how they interact:
AWS Glue: A serverless data integration service that makes it easy to discover, prepare, and combine data for analytics, machine learning, and real-time application development.
Apache Spark: An open-source unified analytics engine for large-scale data processing.
Log4J: A reliable, fast, and flexible logging framework (APIs) written in Java, which is used by many different platforms including Apache Spark.
Amazon CloudWatch: A monitoring and observability service built for aggregating logs and metrics from different services.
The Cost of Logging
Logging is crucial for debugging and monitoring applications, but it can lead to high costs if not managed properly. Each log entry consumes storage and, depending on the verbosity of the logs, the cost associated with storing and querying these logs can escalate quickly.
CloudWatch costs can accrue based on several factors:
Log Data Ingestion: CloudWatch charges for each gigabyte of log data ingested. If your applications are highly verbose in their logging, this can result in significant data ingestion charges.
Log Storage: After ingestion, CloudWatch Logs retains this data, charging for the storage per gigabyte per month. The longer you retain logs and the more data you store, the higher the costs.
Data Transfer: While transferring data within the same AWS region is free, transferring log data across regions can incur additional costs.
Configuring Log4J for Spark on AWS Glue
Here’s how you can tailor Log4J on Spark within AWS Glue to trim unnecessary logging and thus reduce costs:
Modify the Log4J Properties File: AWS Glue uses Apache Spark, which in turn uses Log4J for logging. You can customize the logging level by tweaking the log4j.properties file. Lowering the log level from INFO to WARN or ERROR reduces the volume of log entries generated. This directly impacts the cost by decreasing the amount of log data sent to CloudWatch.
  status = error

  rootLogger.level = warn

  # Console Appender
  rootLogger.appenderRef.stdout.ref = STDOUT
  appender.console.type = Console
  appender.console.name = STDOUT
  appender.console.target = SYSTEM_ERR
  appender.console.layout.type = PatternLayout
  appender.console.layout.pattern = %d{yyyy-MM-dd HH:mm:ss,SSS} %p [%t] %c{2} (%F:%M(%L)): %m%n

  # Loggers setting
  # Set the default spark-shell log level to WARN. When running the spark-shell, the
  # log level for this class is used to overwrite the root logger's log level, so that
  # the user can have different defaults for the shell and regular Spark apps.
  logger.spark_repl_main.name = org.apache.spark.repl.Main
  logger.spark_repl_main.additivity = false
  logger.spark_repl_main.level = warn

  logger.spark_deploy_yarn_client.name = org.apache.spark.deploy.yarn.Client
  logger.spark_deploy_yarn_client.additivity = false
  logger.spark_deploy_yarn_client.level = debug

  # Settings to quiet third party logs that are too verbose
  logger.spark_jetty.name = org.spark_project.jetty
  logger.spark_jetty.additivity = false
  logger.spark_jetty.level = warn

  logger.spark_jetty_util_abstract_lifecycle.name = org.spark_project.jetty.util.component.AbstractLifeCycle
  logger.spark_jetty_util_abstract_lifecycle.additivity = false
  logger.spark_jetty_util_abstract_lifecycle.level = error

  logger.spark_repel_expr_typer.name = org.apache.spark.repl.SparkIMain$exprTyper
  logger.spark_repel_expr_typer.additivity = false
  logger.spark_repel_expr_typer.level = warn

  logger.spark_repel_loop_interpreter.name = org.apache.spark.repl.SparkILoop$SparkILoopInterpreter
  logger.spark_repel_loop_interpreter.additivity = false
  logger.spark_repel_loop_interpreter.level = warn

  logger.apache_parquet.name = org.apache.parquet
  logger.apache_parquet.additivity = false
  logger.apache_parquet.level = error

  logger.parquet.name = parquet
  logger.parquet.additivity = false
  logger.parquet.level = error

  logger.sql_datasource_parquet.name = org.apache.spark.sql.execution.datasources.parquet
  logger.sql_datasource_parquet.additivity = false
  logger.sql_datasource_parquet.level = error

  logger.sql_datasource_file_scan_rdd.name = org.apache.spark.sql.execution.datasources.FileScanRDD
  logger.sql_datasource_file_scan_rdd.additivity = false
  logger.sql_datasource_file_scan_rdd.level = error

  logger.hadoop_codec_pool.name = org.apache.hadoop.io.compress.CodecPool
  logger.hadoop_codec_pool.additivity = false
  logger.hadoop_codec_pool.level = error

  # SPARK-9183: Settings to avoid annoying messages when looking up nonexistent UDFs in SparkSQL with Hive support
  logger.hive_retrying_hms_handler.name = org.apache.hadoop.hive.metastore.RetryingHMSHandler
  logger.hive_retrying_hms_handler.additivity = false
  logger.hive_retrying_hms_handler.level = fatal

  logger.hive_function_registry.name = org.apache.hadoop.hive.ql.exec.FunctionRegistry
  logger.hive_function_registry.additivity = false
  logger.hive_function_registry.level = error

  # Remove DynamoDB tedious messages
  logger.ddb_page_result_multiplexer.name = org.apache.hadoop.dynamodb.preader.PageResultMultiplexer
  logger.ddb_page_result_multiplexer.additivity = false
  logger.ddb_page_result_multiplexer.level = off

  logger.ddb_read_worker.name = org.apache.hadoop.dynamodb.preader.ReadWorker
  logger.ddb_read_worker.additivity = false
  logger.ddb_read_worker.level = off

  packages = com.amazonaws.services.glue.cloudwatch

  # Progress Bar Appender; Progress bar content will not be added to dockerlog or cx error log
  appender.progress_bar.type = CloudWatchAppenderLog4j2
  appender.progress_bar.name = BAR
  appender.progress_bar.layout.type = PatternLayout
  appender.progress_bar.layout.pattern = %m%n

  appender.progress_bar.filter.bar_level_filter.type = CloudWatchLevelRangeFilter
  appender.progress_bar.filter.bar_level_filter.loggerToMatch = com.amazonaws.services.glue.ui.GlueConsoleProgressBar
  appender.progress_bar.filter.bar_level_filter.minLevel = fatal
  appender.progress_bar.filter.bar_level_filter.maxLevel = warn
  appender.progress_bar.filter.bar_level_filter.onMatch = accept
  appender.progress_bar.filter.bar_level_filter.onMismatch = deny

  loggers = BarLogger
  logger.BarLogger.name = com.amazonaws.services.glue.ui.GlueConsoleProgressBar
  logger.BarLogger.level = error
  logger.BarLogger.additivity = false
  logger.BarLogger.appenderRef.progress_bar.ref = BAR
  appender.progress_bar.flushInterval=5
  appender.progress_bar.maxRetries=5
  appender.progress_bar.logStream=progress-bar
  appender.progress_bar.logGroup=/aws-glue/jobs/logs-v2
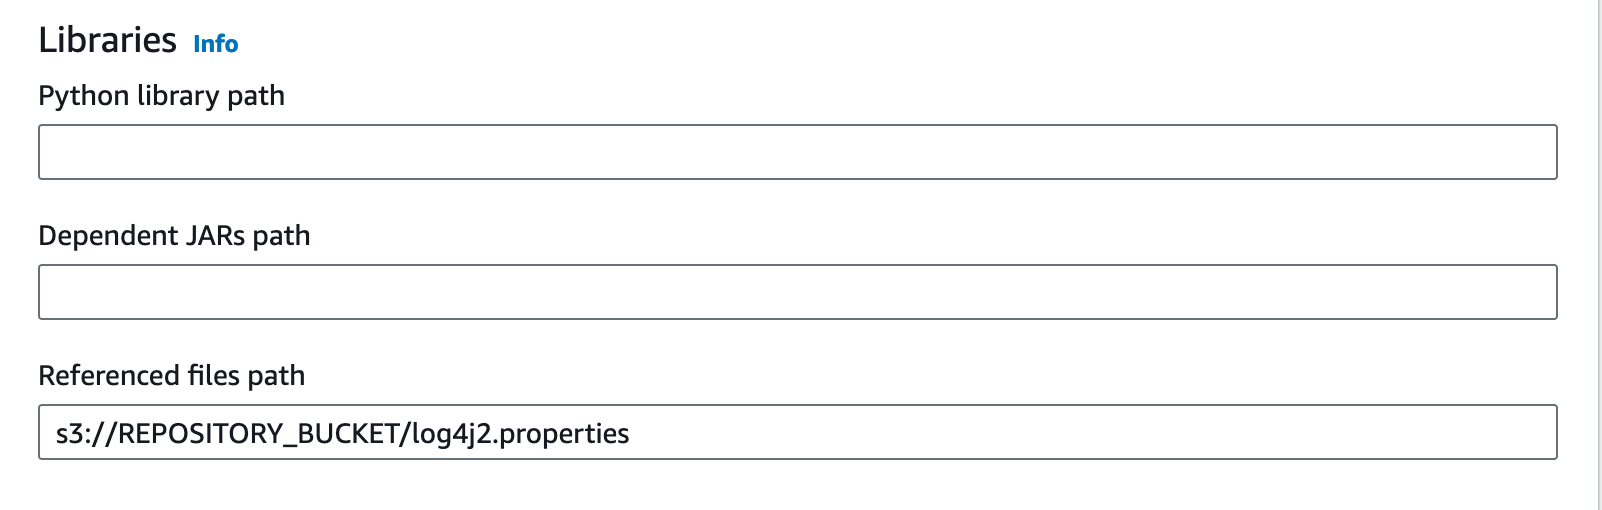
Modify Glue job to read the Log4J configuration
Now you need to change the Glue job to inject the log properties into Spark configuration.
- If you are using AWS console, you need to write the properties file path in the
Referenced files pathpart:
If you are using CDK, you can pass as the --extra-files parameter:
  glue_alpha.Job(
              self,
              "GlueJob",
              default_arguments={
              "--extra-files": f"s3://{artifacts_bucket.bucket_name}/log4j2.properties"
              }
          )
Conclusion
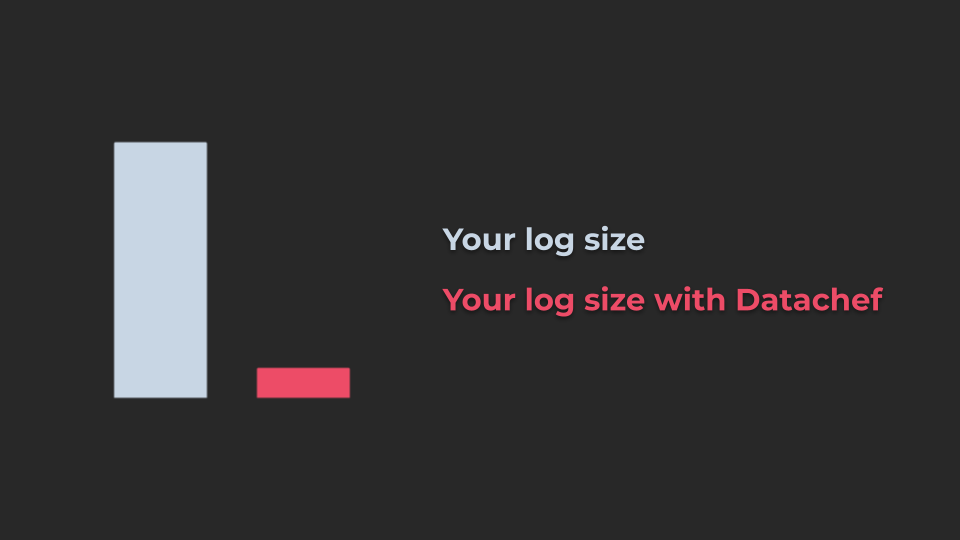
Optimizing your logging strategy within AWS Glue by customizing Log4J for Spark applications is a practical step towards managing cloud expenditure effectively. By fine-tuning the logging levels and adopting a more strategic logging approach, you can significantly reduce costs while maintaining the necessary visibility into your applications’ performance and health. Regular monitoring and adjustments ensure that your logging remains both effective and economical.
If you are interested to get more insight about your cloud costs, you can check how DataChef implemented its own CDK Budget monitoring constructs.