Custom dashboard for Great Expectations
Enable advanced dashboarding on Great Expectation results using metrics

Introduction
Nowadays, Great Expectations is a very viable option for most of the organizations to introduce data quality solution for their data platform. Simplicity, being easily customizable and relying on the toolbox that is mostly known to modern data engineers, are the common factors which help with lowering the adaption barrier.
However, there is one part of Great Expectation, which I hoped to see significant improvement some day. The static dashboards! They are:
Static! And not much customizable.
Lack governance and require extra effort to manage users.
Lack features like a search bar, or historical or any other kind of specialized reports.
Lack direct access to logs.
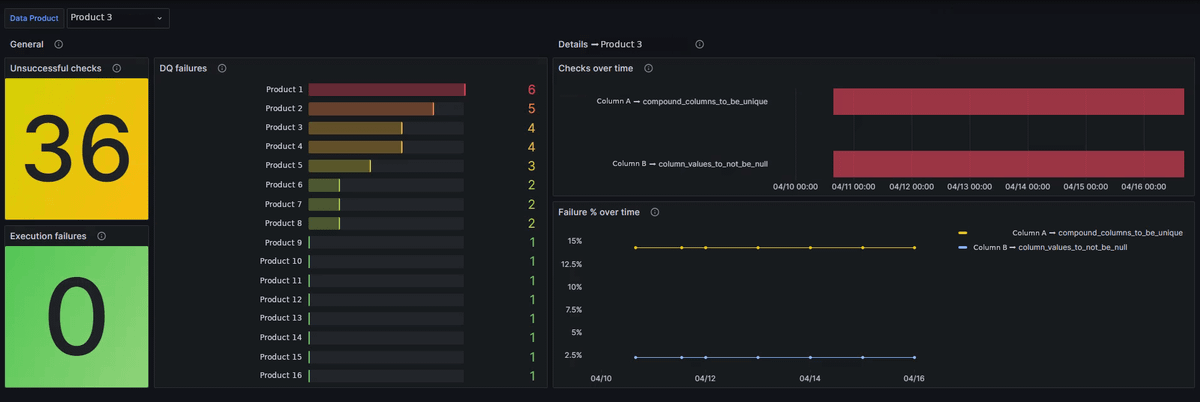
In one of our recent projects at DataChef, we found ourselves, faced with these limitations, and thought it's time to build on top of the flexibility which Great Expectation already provides. The idea was simple. When running the suits, we wanted to generate metrics based on the findings, so we can use any modern dashboarding tool, to visualize the reports. For us, the following were the main pros of this approach:
Customizability of the dashboards.
Relying on existing monitoring dashboards, and providing a holistic view over the whole life cycle of the data products (not just data quality).
Less maintenance and user management requirements.
How to do it?
The main part of the process, to extract metrics, remains the same as usual. The interesting part happens, after running the checkpoint. This is where you have something like the following:
checkpoint = context.get_validator(
    app_id,
    context,
    validator=validator
).run()
The result of this piece, is a very nested object containing the report of the expectation suit, which unfortunately is not very well documented. However, the concept is simple, which helps us to extract valuable metrics from the result. We need to:
Find the validation identifier.
Get the corresponding result object.
For each column in the result set, publish related metrics, if it applies.
This is how it looks like in code:
def get_columns(result_object: list[dict], delimiter: str = '_') -> str | None:
    """Given the result object, extract the column name.

    The column name might be a list, in that case, make a string,
    using delimiter.

    Args:
        result_object (list[dict]): Great Expectation's result object.
        delimiter (str): Delimiter to use for list columns.

    Returns:
        column name if exists.
    """
    kwargs = result["expectation_config"]["kwargs"]
    column = kwargs.get("column")
    columns = kwargs.get("columns")
    column_list = kwargs.get("column_list")

    if column:
        return column
    elif columns:
        return "_".join(columns)
    elif column_list:
        return "_".join(column_list)

def process_checkpoint(checkpoint: list[dict], target_table: str) -> None:
    """Process Great Expectation checkpoint object, and invoke `publish_metrics` method.

    Args:
        checkpoint (list[dict]): The great expectation checkpoint object.
        target_table (str): Name of the target table used by GX.
    """
    run_results = checkpoint.get("run_results")
    if not run_results:
        raise Exception("Couldn't find run_result. Make sure you are using correct GX API")

    run_id = next(iter(run_results))
    results = run_results[run_id]["validation_result"]["result"]
    for result in results:
        columns = get_columns(result)
        rule = result["expectation_config"]["expectation_type"]

        element_count = result["result"]["element_count"]
        success = 1 if result["success"] else 0
        error = 1 if result["exception_info"]["raised_exception"] else 0
        failure_rate = result["result"]["unexpected_percent"]

        publish_metrics(
            target_table=target_table,
            element_count=element_count,
            success=success,
            error=error
            failure_rate=failure_rate
        )

def publish_metrics():
    ...
And with that, all you need to do, is define the publish_metrics method, targeting your desired system. We used AWS CloudWatch for it, but in theory, any other system can be used.
For visualizations, you can use any system too. We used Grafana, which was very useful for our needs, especially since our organization's observability already depended on it.
Conclusion
I think Great Expectation is already doing an impressive job, on the validation side of the data quality. It would've been nice, if the project, was expanding its flexibility of choice, to the dashboarding part as well.
We covered how simple this can be extracted in this blog post. The only possible bottleneck would be the change of the APIs used for metrics, which are not guaranteed to remain the same.


